Vicia faba SV channel VfTPC1 is a hyperexcitable variant of plant vacuole Two Pore Channels
- Julius-Maximilians-Universität (JMU), Biocenter, Department of Molecular Plant Physiology and Biophysics, Germany
- School of Life Sciences, Zhengzhou University, China
- Universidad de Talca, Faculty of Engineering, Center of Bioinformatics, Simulation and Modeling, Chile
- University of California San Francisco, Department of Biochemistry and Biophysics, United States
- Julius-Maximilians-Universität (JMU), Biocenter, Theodor-Boveri-Institute, Department of Biotechnology and Biophysics, Germany
- Ludwig Maximilians-Universität, Faculty of Medicine, Walther Straub Institute of Pharmacology and Toxicology, Germany
- Department of Cell Biology and Molecular Genetics, University of Maryland, United States
Figures
Figure 1
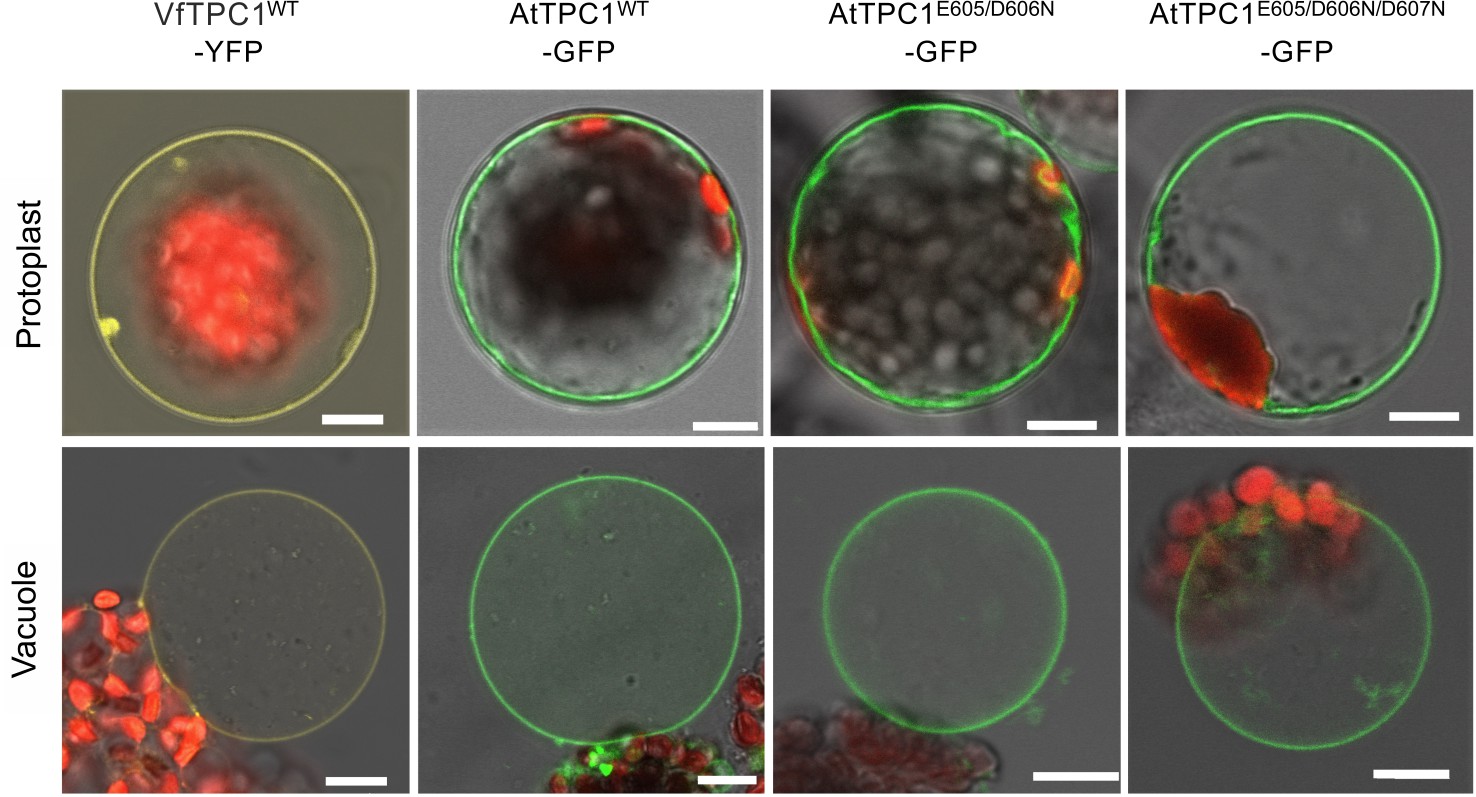
Vacuolar targeting of TPC1 channel variants.
Mesophyll protoplasts from the Arabidopsis thaliana mutant tpc1-2 after transient transformation with the respective GFP/YFP-tagged TPC1 channel construct and released vacuoles. Wild-type TPC1 constructs are indicated by WT. Bright field and fluorescent images were merged. Red fluorescence corresponds to chloroplast autofluorescence. The yellow and green fluorescence represent the YFP and GFP fluorescence, respectively. Scale bars = 10 µm.
Figure 2 with 1 supplement
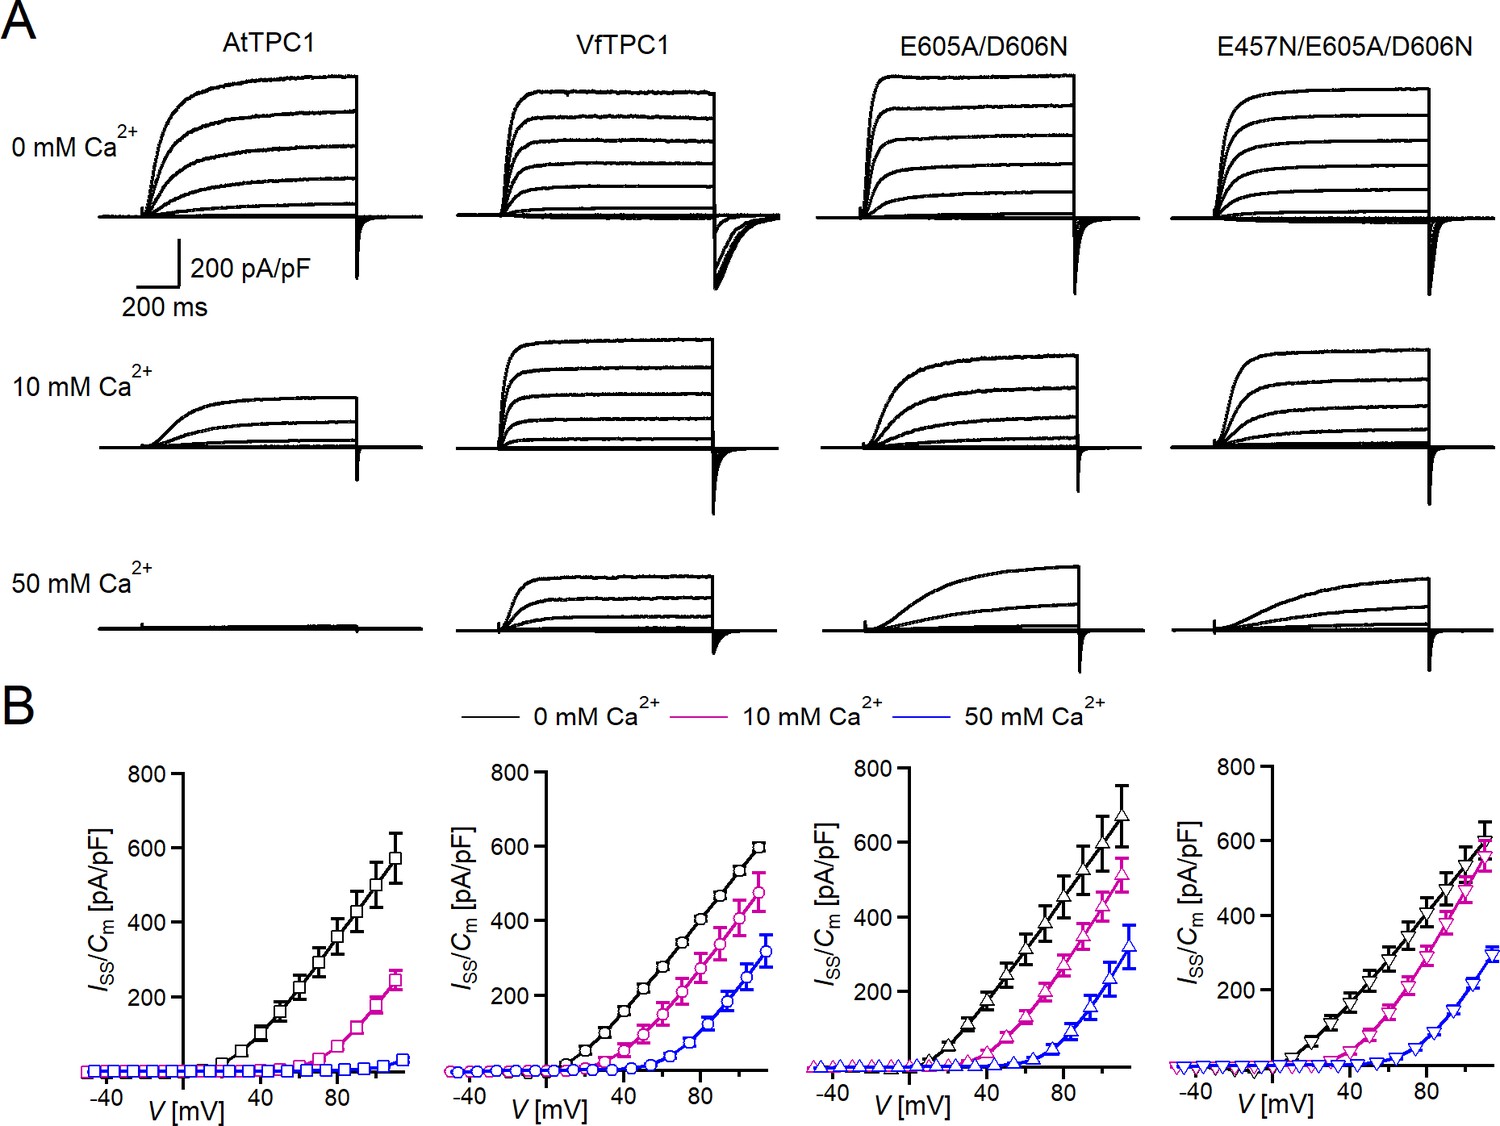
Effect of voltage and luminal Ca2+ on TPC1/SV currents of Vicia faba and Arabidopsis thaliana channel variants.
(A) Macroscopic TPC1/SV current recordings from mesophyll vacuoles liberated from A. thaliana protoplasts isolated from the TPC1-loss-of-function mutant attpc1-2 and transformed with different TPC1 channel types. E605A/D606N and E457N/E605A/D606N represent AtTPC1 channel mutants. AtTPC1 and VfTPC1 denote wild-type TPC1 channels from A. thaliana and V. faba, respectively. TPC1/SV currents elicited upon depolarizing voltages pulses in the range −80 to +110 mV in 20 mV increments at indicated luminal Ca2+ concentrations are shown. Before and after these voltage pulses, the membrane was clamped to the holding voltage of −60 mV. (B) Normalized TPC1/SV steady-state currents (Iss/Cm) derived from current recordings under different luminal Ca2+ conditions as those shown in (A) were plotted against the clamped membrane voltage (V). Symbols represent means ± SE. Squares = AtTPC1 wild type with n0/10Ca = 5, n50Ca = 4; circles = VfTPC1 wild type with n0Ca = 5, n10/50Ca = 6; upright triangles = AtTPC1-E605A/D606N with n0/10Ca = 5, n50Ca = 4; reversed triangles = AtTPC1-E457N/E605A/D606N with n0/10Ca = 5, n50Ca = 4. In (B), AtTPC1 wild-type data at 0 and 10 mM Ca2+ are identical to those shown in Dickinson et al., 2022; Creative Commons Attribution-Non Commercial-NoDerivatives License 4.0; CC BY-NC-ND. Experiments in (A, B) were performed under symmetric K+ conditions (150 mM) with 1 mM cytosolic Ca2+ and luminal Ca2+ at the indicated concentration. For further details on the voltage pulse protocol and solutions, see Materials and methods.
-
Figure 2—source data 1
Quantification of normalized steady-state current amplitudes of Arabidopsis thaliana TPC1 channel variants and Vicia faba TPC1 expressed in the Arabidopsis mutant attpc1-2.
- https://cdn.elifesciences.org/articles/86384/elife-86384-fig2-data1-v1.xlsx
Figure 2—figure supplement 1

Species-dependent effect on voltage activation threshold of TPC1/SV currents.
(A) Enlarged section of the current–voltage plots (Iss/Cm(V)) for AtTPC1 wild type and VfTPC1 shown in Figure 2B at 0 mM luminal Ca2+. Symbols represent means ± SE. Squares = AtTPC1 wild type with n = 5; circles = VfTPC1 wild type with n = 5. (B) Enlarged section of the current–voltage plots (Iss/Cm(V)) for AtTPC1 wild type and mutant channels shown in Figure 2B at 0 mM luminal Ca2+. Symbols represent means ± SE. Squares = AtTPC1 wild type; upright triangles = AtTPC1-E605A/D606N with n = 5; reversed triangles = AtTPC1-E457N/E605A/D606N. Number of experiments with individual vacuoles for each channel type was n = 5. AtTPC1 wild-type data at 0 mM Ca2+ are identical to those shown in Dickinson et al., 2022 (Creative Commons Attribution-Non Commercial-NoDerivatives License 4.0; CC BY-NC-ND).
Figure 3
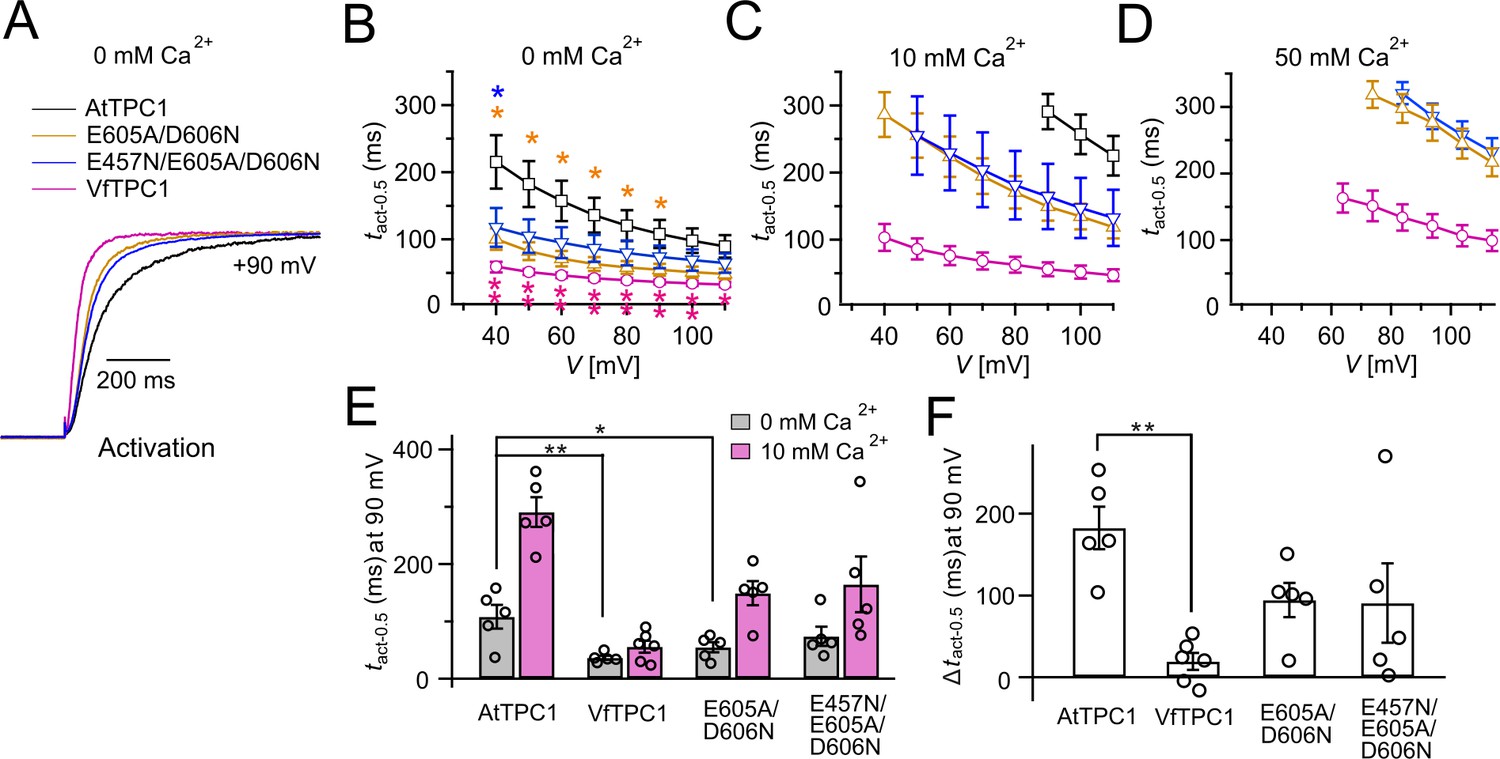
Half-activation times of TPC1 channel variants.
(A) Representative current relaxation induced upon a voltage pulse from the holding voltage of −60 to +90 mV at 0 mM luminal Ca2+. Normalized current responses of the vacuoles equipped with one of the indicated TPC1 channel variants were superimposed. (B–D) Half-activation times (tact-0.5) of the voltage-induced TPC1 currents at indicated luminal Ca2+ concentrations. In (B), stars denote that the tact-0.5 values of VfTPC1 (magenta), the ATPC1 double mutant E605A/D606N (yellow), and AtTPC1 triple mutant (blue) significantly differ from AtTPC1 wild type (one-way analysis of variance [ANOVA] together with a Dunnett’s post hoc comparison test; *p < 0.05; **p < 0.01). (E) Comparison of half-activation times determined at +90 mV for 0 and 10 mM luminal Ca2+. tact-0.5 values under 0 mM luminal Ca2+ were tested for significant differences with one-way ANOVA combined with a Dunnett’s post hoc comparison test (*p < 0.05; **p < 0.01). (F) The differences in the half-activation times from (E) between 0 and 10 luminal Ca2+ (one-way ANOVA together with a Dunnett’s post hoc comparison test; **p < 0.01). In (B–F) the number of experiments (n) was identical with Figure 2B, and data are represented as means ± SE. In (E, F), individual data points were additionally inserted as open black circles into the bar chart. Experiments in (A–F) were performed with vacuoles from attpc1-2 mesophyll protoplasts transiently transformed with the indicated TPC1 channel variants. Symmetric K+ conditions (150 mM) were used with 1 mM cytosolic Ca2+ and luminal Ca2+ at indicated concentration. For details on the voltage pulse protocol and solutions, see Materials and methods.
-
Figure 3—source data 1
Quantification of current activation kinetics of Arabidopsis thaliana TPC1 channel variants and Vicia faba TPC1 expressed in the Arabidopsis mutant attpc1-2.
- https://cdn.elifesciences.org/articles/86384/elife-86384-fig3-data1-v1.xlsx
Figure 4
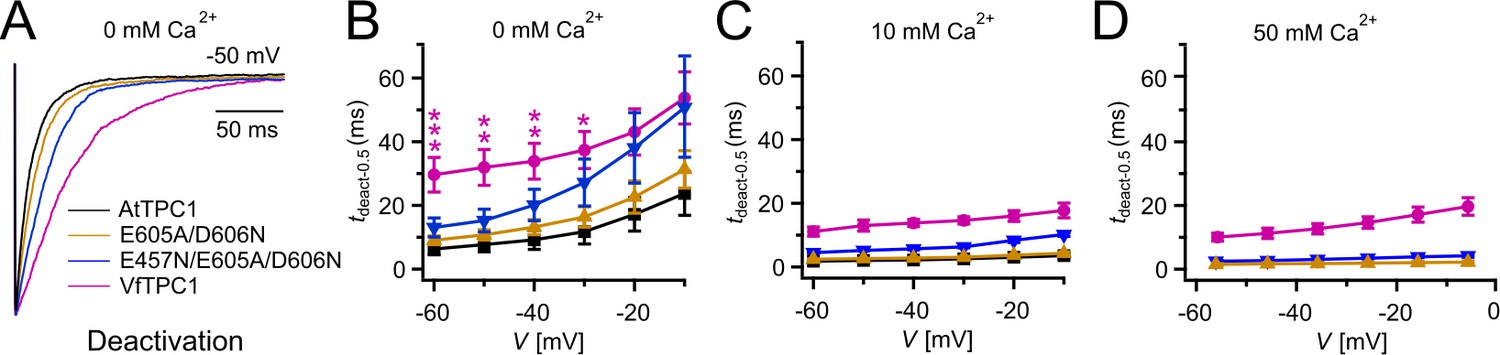
Half-deactivation times of TPC1 channel variants.
(A) Representative current relaxation induced upon a voltage pulse from +80 mV (VfTPC1) or +100 mV (AtTPC1 channel variants) to −50 mV at 0 mM luminal Ca2+. Normalized current responses of the vacuoles equipped with one of the indicated TPC1 channel variants were superimposed. (B–D) Half-deactivation times (tdeact-0.5) of the TPC1-mediated slow vacuolar (SV) currents at indicated luminal Ca2+ concentrations plotted against the respective membrane voltages. In (B), stars denote significant differences between VfTPC1 and AtTPC1 wild type (one-way analysis of variance [ANOVA] together with a Dunnett’s post hoc comparison test; *p < 0.05; **p < 0.01; ***p < 0.001). In (B–D), data represent means ± SE, and the number of experiments (n) was as follows: AtTPC1 wild type n0Ca = 5, n10Ca = 3; VfTPC1 wild type n0/10Ca = 4, n50Ca = 6; AtTPC1-E605A/D606N n0 /50Ca = 4, n10Ca = 5; AtTPC1-E457N/E605A/D606N n0/10Ca = 5, n50Ca = 4. Experiments in (A–D) were performed with vacuoles from attpc1-2 mesophyll protoplasts transiently transformed with the indicated TPC1 channel variants. Symmetric K+ conditions (150 mM) were used with 1 mM cytosolic Ca2+ and luminal Ca2+ at the indicated concentration. For details on the double-voltage pulse protocol and solutions, see Materials and methods.
-
Figure 4—source data 1
Quantification of current deactivation kinetics of Arabidopsis thaliana TPC1 channel variants and Vicia faba TPC1 expressed in the Arabidopsis mutant attpc1-2.
- https://cdn.elifesciences.org/articles/86384/elife-86384-fig4-data1-v1.xlsx
Figure 5
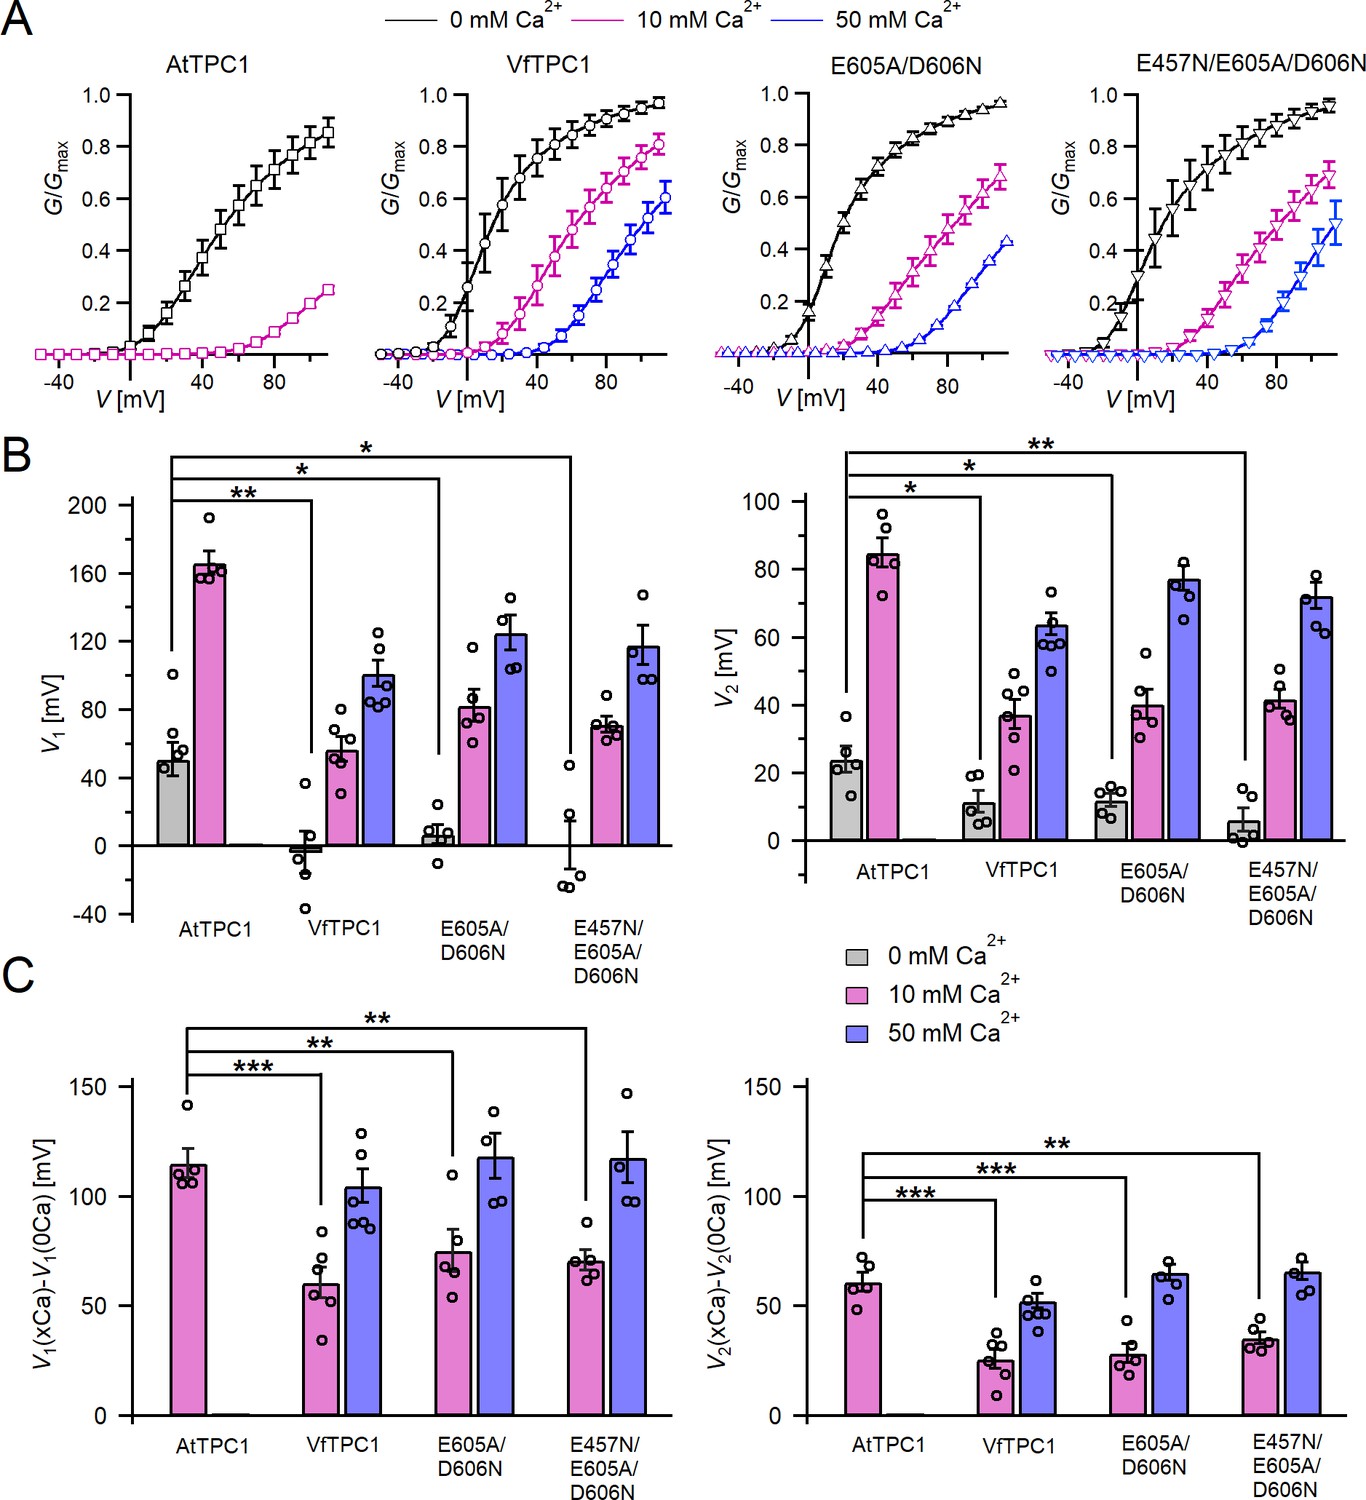
Channel activity of Vicia faba and Arabidopsis thaliana TPC1 channel variants in response to membrane voltage and luminal Ca2+.
(A) Conductance–voltage plots (G/Gmax(V)) determined for the different TPC1 channel variants as a measure for their relative open-channel probability under indicated luminal Ca2+ conditions. Best fits of the G/V plots to a double Boltzmann function are given by the solid lines. Squares = AtTPC1 wild type, circles = VfTPC1 wild type, upright triangles = AtTPC1-E605A/D606N, reversed triangles = AtTPC1-E457N/E605A/D606N. (B) The midpoint voltages V1 (left) and V2 (right) derived from the fits of the G/V plots shown in (A) are given for the different channel variants at the indicated Ca2+ condition. To test for significant differences between the V1/2 values under 0 mM luminal Ca2+, a statistical analysis was performed with one-way analysis of variance (ANOVA) combined with a Dunnett’s post hoc comparison test (*p <0 .05, **p < 0.01). (C) The differences in the midpoint voltages V1 (left) and V2 (right) shown in (B) between 0 and 10 and if available between 0 and 50 luminal Ca2+ are shown. The changes in V1/2 values related to a rise from 0 to at 10 Ca2+ were statistically analyzed with one-way ANOVA together with a Dunnett’s post hoc comparison test (**p < 0.01; ***p <0 .001). In (B) and (C), individual data points were inserted as open black circles into the bar chart. In (A–C), the number of experiments (n) was as follows: AtTPC1 wild type n0/10Ca = 5; VfTPC1 wild type with n0Ca = 5, n10/50Ca = 6; AtTPC1-E605A/D606N n0/10Ca = 5, n50Ca = 4; AtTPC1-E457N/E605A/D606N n0/10Ca = 5, n50Ca = 4. Data in (A–C) represent means ± SE. AtTPC1 wild-type data at 0 and 10 mM Ca2+ are identical to those shown in Dickinson et al., 2022 (Creative Commons Attribution-NonCommercial-NoDerivatives License 4.0; CC BY-NC-ND). Experiments in (A–C) were performed with vacuoles from attpc1-2 mesophyll protoplasts transiently transformed with the indicated TPC1 channel variants. Symmetric K+ conditions (150 mM) were used with 1 mM cytosolic Ca2+ and luminal Ca2+ at the indicated concentration. For details on the analysis of tail current recordings, the associated pulse protocol and solutions, see Materials and methods.
-
Figure 5—source data 1
Quantification of normalized conductance/voltage curves of Arabidopsis thaliana TPC1 channel variants and Vicia faba TPC1 expressed in the Arabidopsis mutant attpc1-2.
- https://cdn.elifesciences.org/articles/86384/elife-86384-fig5-data1-v1.xlsx
Figure 6 with 1 supplement
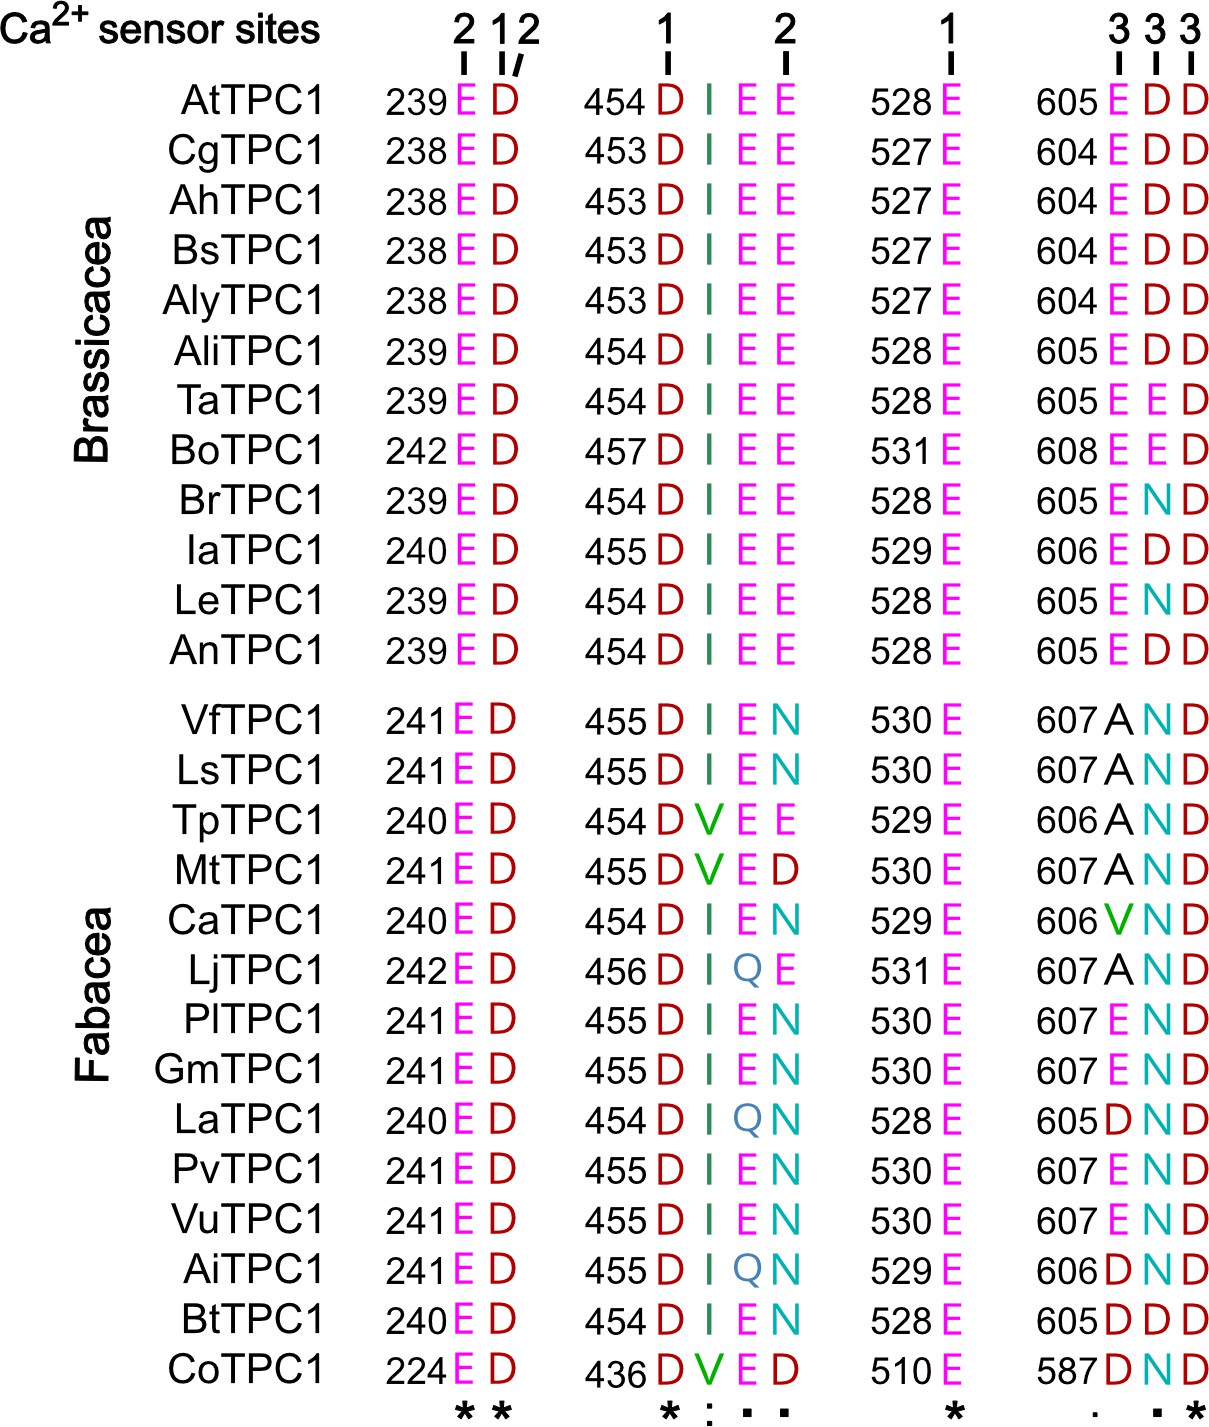
Polymorphism of functional TPC1 channel domains with a role in luminal Ca2+ coordination.
Sections of an amino acid sequence alignment of Brassicacea and Fabacea TPC1 channels in the region of the three Ca2+ sensor sites. The numbers above the residues of AtTPC1 indicate to which Ca2+ sensor site they contribute. A different color code was used for different amino acids. An asterisk marks 100% conserved residues across the sequences while a colon (:) indicates a conservative and a dot (.) denotes a non-conservative substitution. TPC1 sequences from following species were used: Arabidopsis thaliana (AtTPC1), Capsella grandiflora (CgTPC1), Arabidopsis halleri (AhTPC1), Boechera stricta (BsTPC1), Arabidopsis lyrata (AlyTPC1), Alyssum linifolium (AliTPC1), Thlaspi arvense (TaTPC1), Brassica oleracea (BoTPC1), Brassica rapa (BrTPC1), Iberis amara (IaTPC1), Lepidium sativum (LeTPC1), Arabis nemorensis (AnTPC1), Vicia faba (VfTPC1), Lathyrus sativus (LsTPC1), Trifolium pratense (TpTPC1), Medicago truncatula (MtTPC1), Cicer arietinum (CaTPC1), Lotus japonicus (LjTPC1), Phaseolus lunatus (PlTPC1), Glycine max (GmTPC1), Lupinus albus (LaTPC1), Phaseolus vulgaris (PvTPC1), Vigna unguiculata (VuTPC1), Arachis ipaensis (AiTPC1), Bauhinia tomentosa (BtTPC1), and Copaifera officianalis (CoTPC1). Amino acid sequences and their sources are listed in Figure 6—source data 1.
-
Figure 6—source data 1
Amino acid sequences of plant TPC1 channels and their accession numbers.
- https://cdn.elifesciences.org/articles/86384/elife-86384-fig6-data1-v1.xlsx
Figure 6—figure supplement 1

Consensus tree of Brassicacea and Fabacea TPC1 channel proteins.
Brassicacea TPC1 channels are given in black. Fabacea TPC1 channels divide into two subgroups, highlighted in magenta and blue. After a protein alignment derived with Muscle, an IQ-tree (http://iqtree.cibiv.univie.ac.at) was generated with iTol (vers. 5.7; https://itol.embl.de). Amino acid sequences and their sources are listed in Figure 6—source data 1.
Figure 7
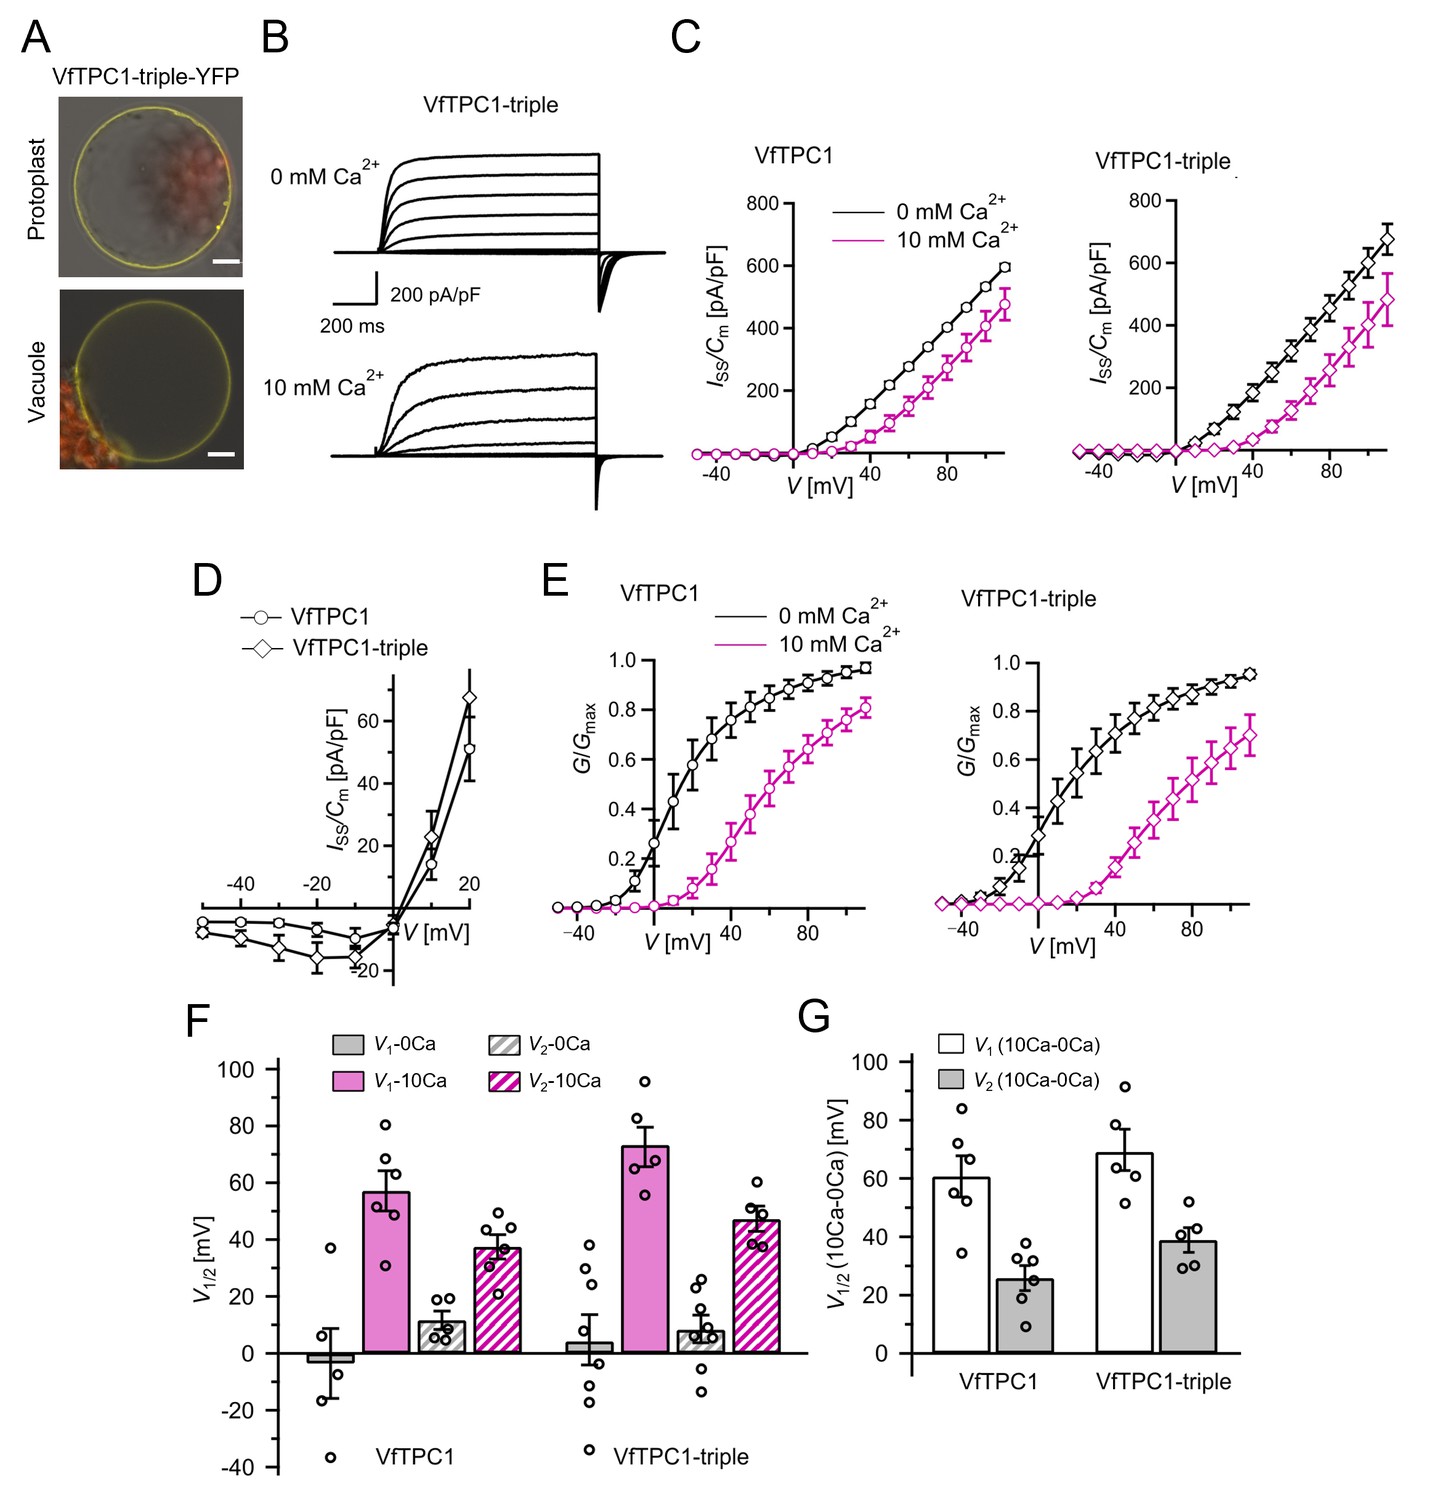
The voltage and luminal Ca2+ dependence of the VfTPC1 triple mutant N458E/A607E/N608D.
(A) Mesophyll vacuoles released from attpc1-2 mesophyll protoplasts after transient transformation with eYFP-tagged VfTPC1 triple mutant construct. Bright field and fluorescent images were merged. Red and yellow fluorescence corresponds to chloroplast autofluorescence and eYFP fluorescence, respectively. Scale bars = 10 µm. (B) Macroscopic TPC1 current recordings from attpc1-2 mesophyll vacuoles transformed with the VfTPC1 triple mutant. (C) Normalized steady-state currents (Iss/Cm(V)) determined for the indicated VfTPC1 channel variant and plotted against the clamped membrane voltages in the presence (10 mM) and absence of luminal Ca2+. (D) Enlarged section of the current–voltage curves (Iss/Cm(V)) for VfTPC1 channel variants shown in (C) at 0 mM luminal Ca2+. (E) Normalized conductance–voltage curves (G/Gmax(V)) of VfTPC1 channel variants in the presence and absence of luminal Ca2+. (F) Midpoint activation voltages V1/2 are given for the different channel variants at the indicated Ca2+ condition. VfTPC1 triple mutant with n0Ca = 8 and n10Ca = 5; VfTPC1 wild type with n0Ca = 5, n10Ca = 6. The data of VfTPC1 wild type in (C–G) are identical to those in Figures 2 and 5 and Figure 2—figure supplement 1 and were shown only for better direct comparison. Data points in (C–G) represent means ± SE. In (F) and (G), individual data points were inserted as open black circles into the bar chart. According to the statistical analysis (t-test), the V1/V2 values at 0 mM Ca2+ (F) and the Ca2+-induced shift in V1/V2 values (G) between VfTPC1 wild-type and the VfTPC1 triple mutant were not significantly different, as the p-values were > 0.05. For details of the statistical analysis, see . Source data for patch-clamp data of the VfTPC1 triple mutant are provided in while those of VfTPC1 wild type are found in Figure 2—source data 1 and Figure 5—source data 1.
-
Figure 7—source data 1
Quantification of normalized steady-state current/voltage curves and normalized conductance/voltage curves of Vicia faba TPC1 triple mutant expressed in the Arabidopsis mutant attpc1-2.
- https://cdn.elifesciences.org/articles/86384/elife-86384-fig7-data1-v1.xlsx
Figure 8
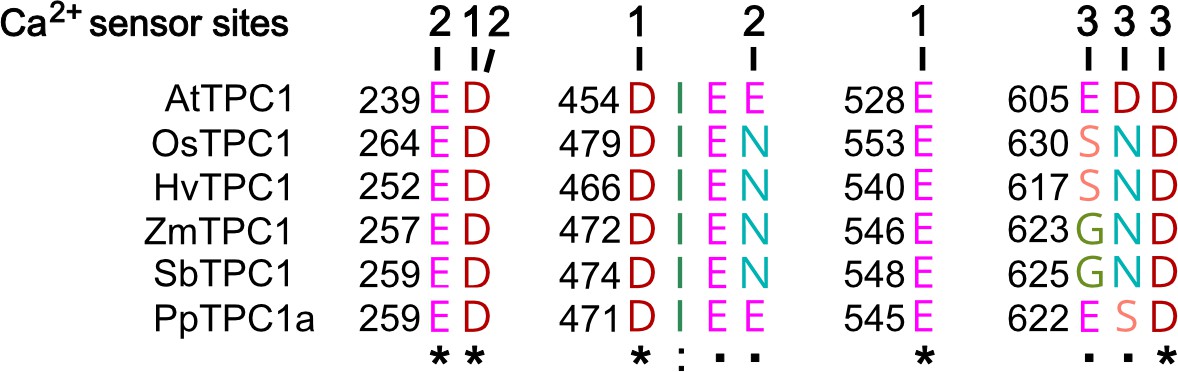
Amino acid sequence comparison of TPC1 channels from different species in the region of the three Ca2+ sensor sites.
The numbers above the residues of AtTPC1 indicate to which Ca2+ sensor site they contribute. A different color code was used for different amino acids. An asterisk marks 100% conserved residues across the sequences while a colon (:) indicates a conservative and a dot (.) denotes a non-conservative substitution. TPC1 sequences from following species were used: Arabidopsis thaliana (AtTPC1), Oryza sativa (OsTPC1), Hordeum vulgaris (HvTPC1), Zea mays (ZmTPC1), Sorghum bicolor (SbTPC1), and Physcomitrella patens (PpTPC1a). Amino acid sequences and their sources are listed in Figure 6—source data 1.
Figure 9 with 1 supplement
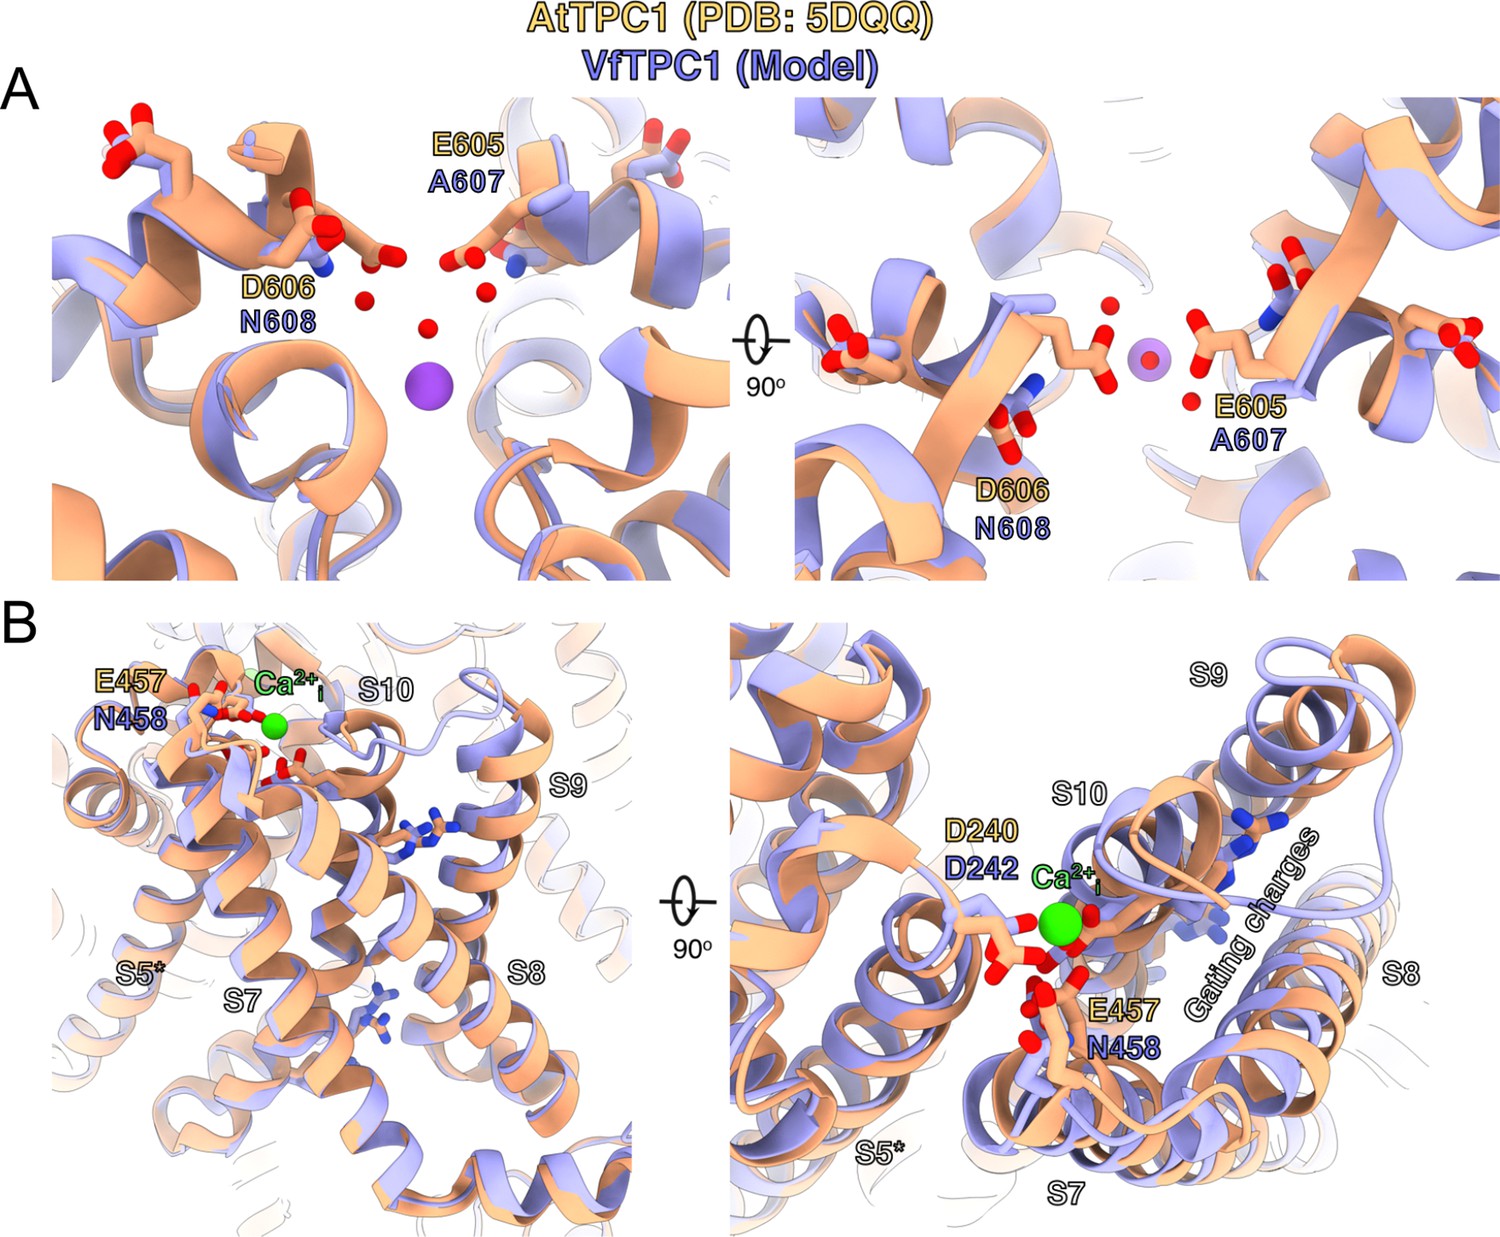
Structural comparison between wild-type AtTPC1 structure (beige color) and a VfTPC1 homology model (purple) depicts the functional consequences of sequence divergence.
(A) Left: side view from in the plane of the membrane of the Ca2+ site showing the external (luminal) pore entry at the top. Right: top view from the external (luminal) surface of the Ca2+ site (90° from the left-side image) showing positions of key pore mouth residues. The central purple spheres represent Na+ ions. Red spheres are waters, as observed in the cryoEM structure of fou2 (Dickinson et al., 2022). (B) Coordination of the luminal Ca2+-binding site (green sphere) on voltage-sensing domain (VSD2). Left: side view from the plane of the membrane of the voltage sensor domain, looking in toward the vertical axis of the pore. S8 helix is closest to the viewing direction. Right: top view from the external surface of the voltage sensor domain. The image is rotated 90° to obtain the top view from the left panel, and rotated in plane of the page such that S8 is on the right side. The gating charges on helix S10 are indicated by labeling. The model is provided by Supplementary file 1. An overview of the structure seen from the plane of the membrane is shown in Figure 9—figure supplement 1.
Figure 9—figure supplement 1

Topology and structural model of VfTPC1.
(A) Topology cartoon of the VfTPC1 protein showing positions of luminal Ca2+-binding sites in comparison to Arabidopsis AtTPC1. (B) 3D model of the VfTPC1 channel in closed conformation using an A. thaliana TPC1 structure (PDB: 5TUA) as template (Guo et al., 2017). Left: front view of the VfTPC1 channel. Position of barium ions (orange) and sodium ions (purple) were transferred from AtTPC1, and subunits are colored in light gray and pink to emphasize the dimeric structure of the channel. Residues forming the selectivity filter (Guo et al., 2017) are highlighted in light orange. The luminal entrance of the VfTPC1 pore – delineated by the amino acids A607/N608 (E605/D606 in AtTPC1) – is highlighted in red. Right: orthogonal top view of VfTPC1 depicting the luminal Ca2+-binding sites, with site 1 (D242/D455/E530) colored in yellow, site 2 (E241/D242/N458) in green, and site 3 (A607/N608) in red. Note that D242 contributes to Ca2+ coordination at site 1 as well as site 2. The luminal entrance cavity (light blue mesh) and the predicted ion permeation pathway were calculated using MoleOnline (Pravda et al., 2018) in channel and pore mode, respectively.
Figure 10 with 1 supplement
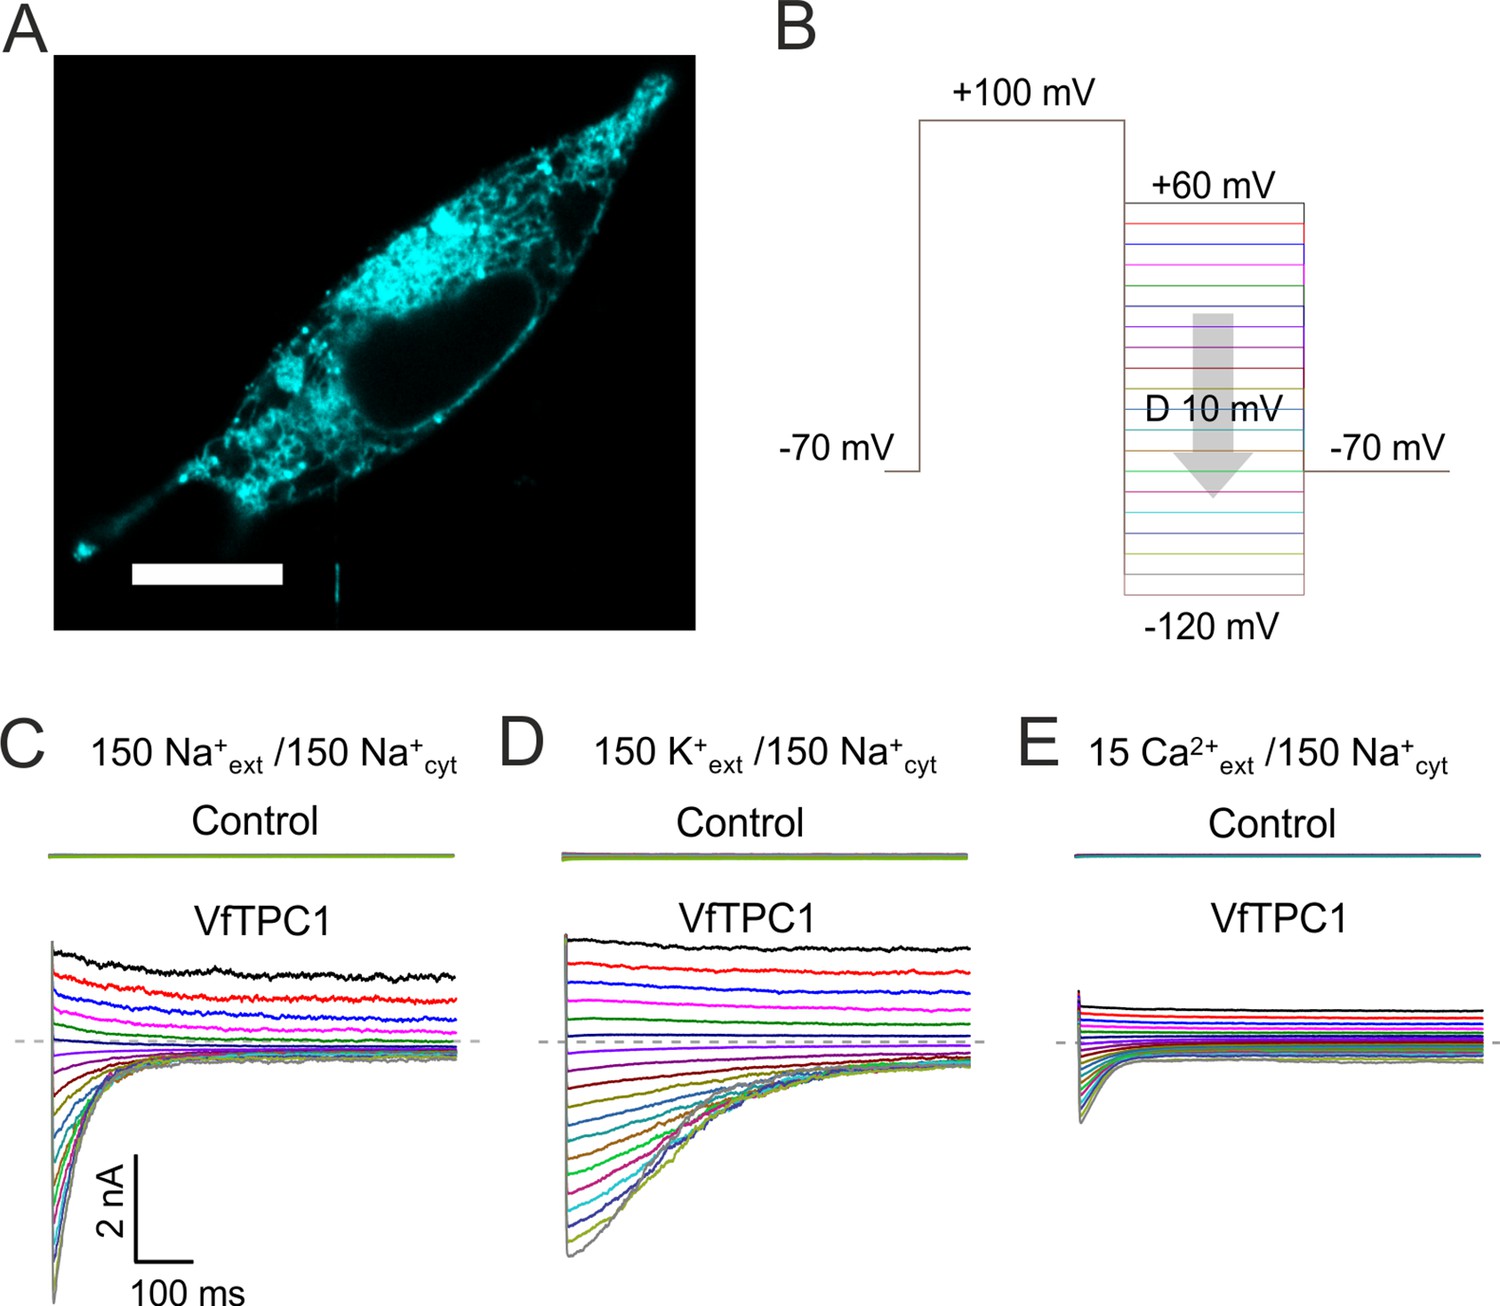
Characterization of VfTPC1 expressed in HEK293 cells.
(A) Confocal laser scanning microscope image of a HEK293 cell expressing eYFP-VfTPC1. Note, that most fluorescence is observed in intracellular membranes but is also present in the plasma membrane. Scale bar = 10 µm. (B–E) Electrophysiologcial characterization of non-transfected (control) and VfTPC1-transfected HEK293 cells by whole-cell patch-clamp techniques. (B) Schematic overview of the protocol used during analysis including an initial activation step (−70 to +100 mV) and a subsequent voltage gradient (+60 to −120 mV) for determining the voltage dependency of TPC1. (C–E) Typical tail current responses of the same control or the same VfTPC1-transfected HEK cell to voltage pulses in different extracellular solutions (in mM) as indicated. The concentration of cytosolic Na+ was always 150 mM. The dashed gray lines indicate the zero current level. For further details of the double-pulse protocol and patch-clamp solutions, see Materials and methods. Total number of control experiments was n = 15, n = 4, and n = 4 with external Na+, K+, and Ca2+, respectively. Note that, on the one hand, the smaller tail currents under external Ca2+-based conditions (E) compared to external Na+- or K+-based conditions (C, D) can be attributed to the 10-fold lower Ca2+ concentration compared with Na+ or K+ concentration. On the other hand, these smaller tail currents under Ca2+ conditions (E) also are in line with recent molecular dynamics (MD) simulations (Navarro-Retamal et al., 2021) suggesting that Ca2+ cannot permeate the channel better than K+ or Na+. This is further supported by (1) the very small single-channel conductance under Ca2+-based solute conditions compared to K+-based solute conditions and (2) the reduced single-channel conductance at a high luminal Ca2+ addition under K+-based solute conditions (Ward and Schroeder, 1994; Figure 11C).
Figure 10—figure supplement 1

Electrophysiological characterization of AtTPC1 in mesophyll vacuoles of Arabidopsis thaliana Col0 in the whole-vacuole patch-clamp configuration.
Typical current traces recorded in response to 400-ms-lasting voltage pulses in the range from +40 to −40 mV, applied in 5 mV decrements after a 600-ms-lasting pre-activating voltage pulse to +80 mV. The dotted gray lines indicate the zero current level. Before and after the double-voltage pulses, the membrane was clamped to the holding voltage of −60 mV. The total time interval between the double-voltage pulses at holding voltage was 3.8 s. Currents shown were measured from individual vacuoles at different luminal (pipette) solutions, as indicated. The pipette solution consisted of 0.1 mM EGTA (Ethylene glycol-bis(β-aminoethyl ether)-N,N,N',N'-tetraacetic acid), 10 mM HEPES (4-(2-Hydroxyethyl)piperazine-1-ethanesulfonic acid) (pH 7.5/Tris) and either 150 mM KCl or 150 mM NaCl. On the cytosolic side, a K+-based bath medium was used that contained 150 mM KCl, 2.5 mM MgCl2, 0.3 mM free CaCl2 (adjusted by adding 4.0 mM EGTA and 4.3 mM Ca2+), 10 mM HEPES (pH 7.5/Tris). Solutions were adjusted with D-sorbitol to an osmolality of 500 mOsmol kg−1. The reversal potential was determined in the same way as from the TPC1 tail currents recorded in HEK cells. The relative permeability ratio PK/PNa was calculated using Equation 1 given in Materials and methods. For this, ΔVrev = VK - VNa was determined by subtracting the reversal potential VNa derived from each of the three individual vacuoles under bi-ionic cation conditions from the reversal potential VK averaged from three other individual vacuoles under symmetric K+ conditions.
Figure 11
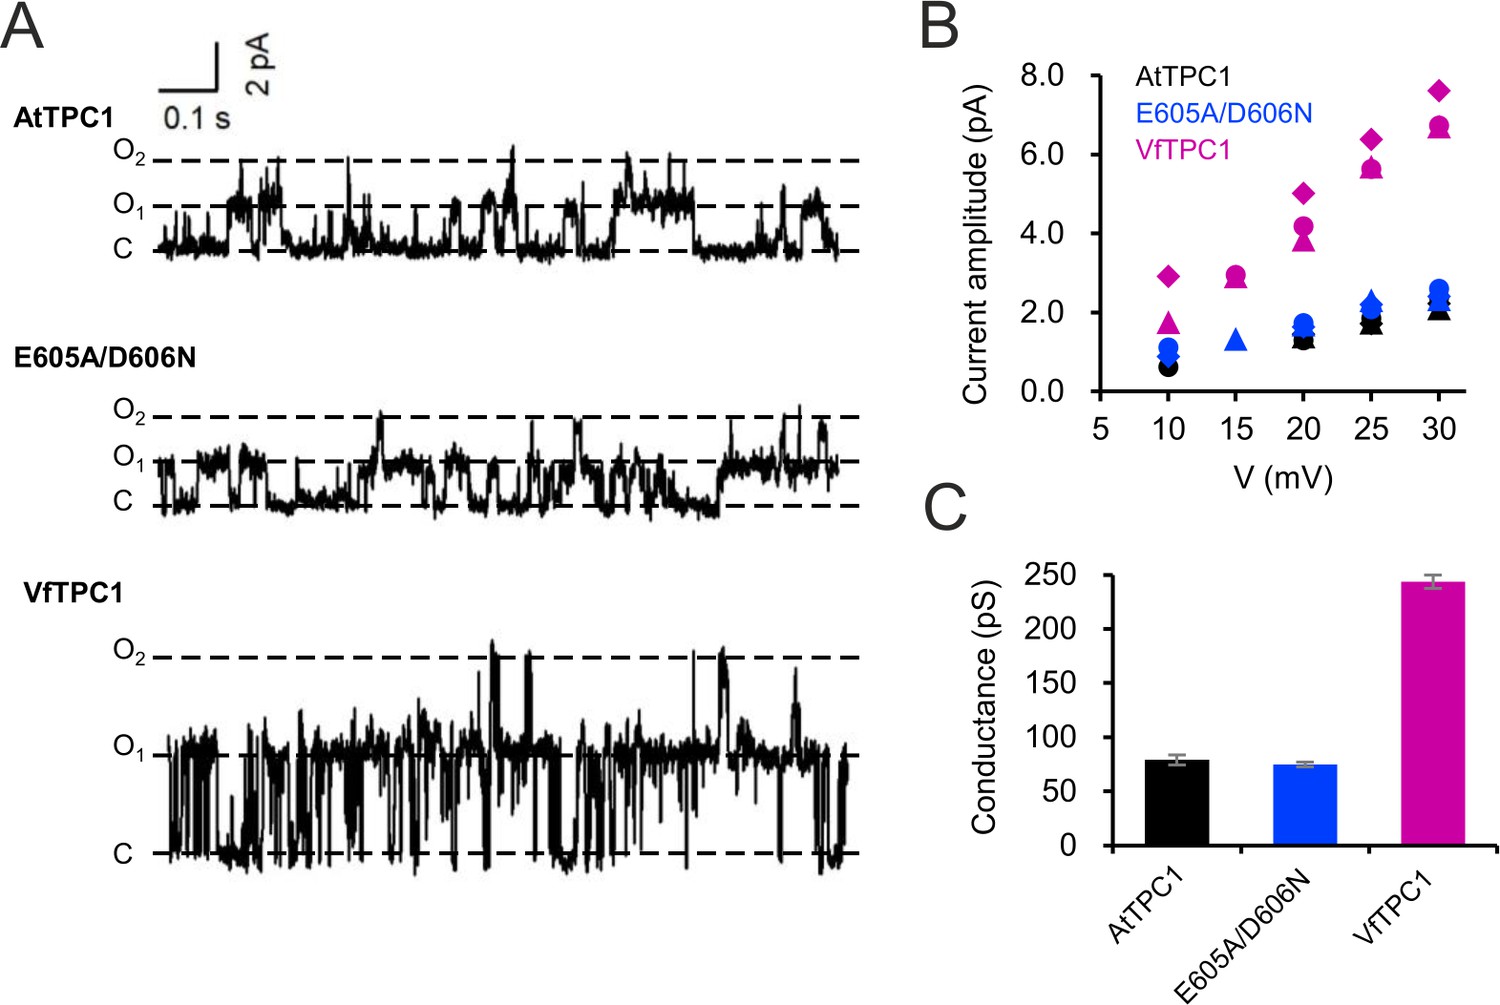
Single-channel analysis of TPC1 channel variants.
(A) Single-channel currents of indicated TPC1 channel variants evoked at +25 mV. The current level C indicates at which all channels were closed, while at current level O1 and O2 one or two TPC1 channels were open. (B) Single-channel current amplitudes determined for indicated TPC1 channel variants plotted against the respective voltages. The channel variants are shown in different color codes. Each different symbol of the same color corresponds to an individual experiment. (C) Bar diagram (means ± SE) gives the unitary conductance of different TPC1 channel variants derived from the linear regression fit of the individual experiments. The number of experiments was n = 3 for each channel variant. Experiments in (A–C) were performed with vacuoles from attpc1-2 mesophyll protoplasts transiently transformed with the indicated TPC1 channel variants. Symmetric K+ conditions (100 mM) were used with 0 and 0.5 mM Ca2+ at the luminal and cytosolic side of the vacuole membrane, respectively. For more details on patch-clamp solutions, see Materials and methods.
-
Figure 11—source data 1
Quantification of single-channel conductance of TPC1 channel variants.
- https://cdn.elifesciences.org/articles/86384/elife-86384-fig11-data1-v1.xlsx
Figure 12 with 1 supplement
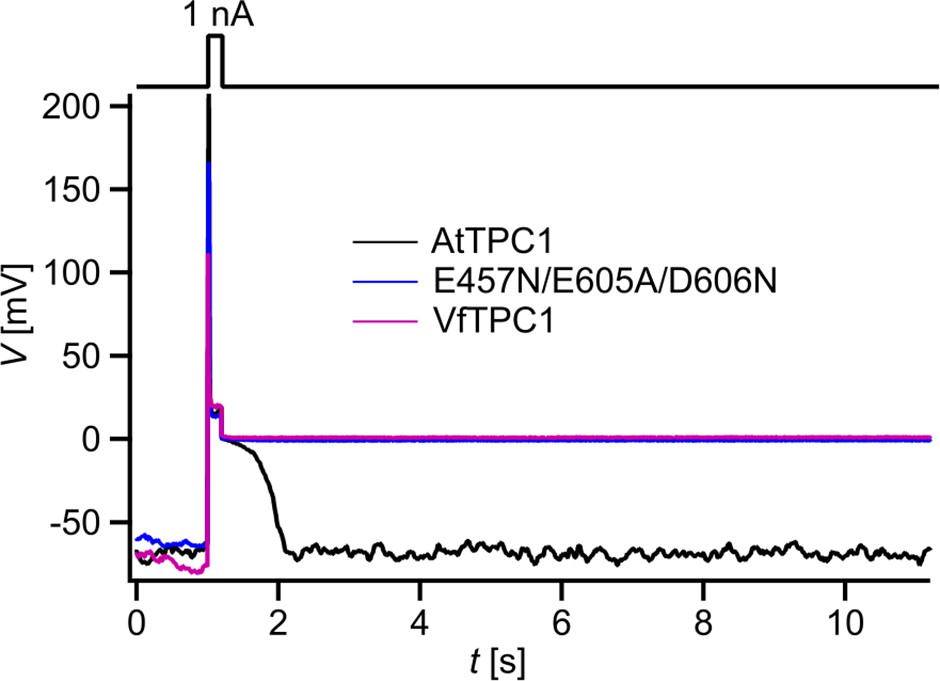
Dependency of vacuole excitability on TPC1 channel variants.
Superimposed voltage responses (lower panel) of individual attpc1-2 vacuoles equipped with either VfTPC1 wild type (magenta), AtTPC1 wild type (black), or AtTPC1-triple mutant E457N/E605A/D606N (blue) after transient transformation, to current injection of 1 nA (upper panel). Number of experiments for each channel type was n = 6. Lifetimes of the post-stimulus depolarization phase from each individual experiment are given in Figure 12—source data 1. Please note, the corresponding current responses from the same TPC1-expressing vacuoles are shown in Figure 12—figure supplement 1D–F. All experiments were carried out under symmetric K+ conditions (150 mM) at 0.2 mM luminal free Ca2+ and 1 mM Ca2+ together with 2 mM Mg2+ at the cytosolic side of the membrane. For more details on patch-clamp solutions, see Materials and methods.
-
Figure 12—source data 1
TPC1-dependent lifetime of the post-stimulus depolarization phase.
- https://cdn.elifesciences.org/articles/86384/elife-86384-fig12-data1-v1.pdf
-
Figure 12—source data 2
Quantification of voltage- and current-clamp data shown in Figure 12—figure supplement 1B–F.
- https://cdn.elifesciences.org/articles/86384/elife-86384-fig12-data2-v1.xlsx
Figure 12—figure supplement 1
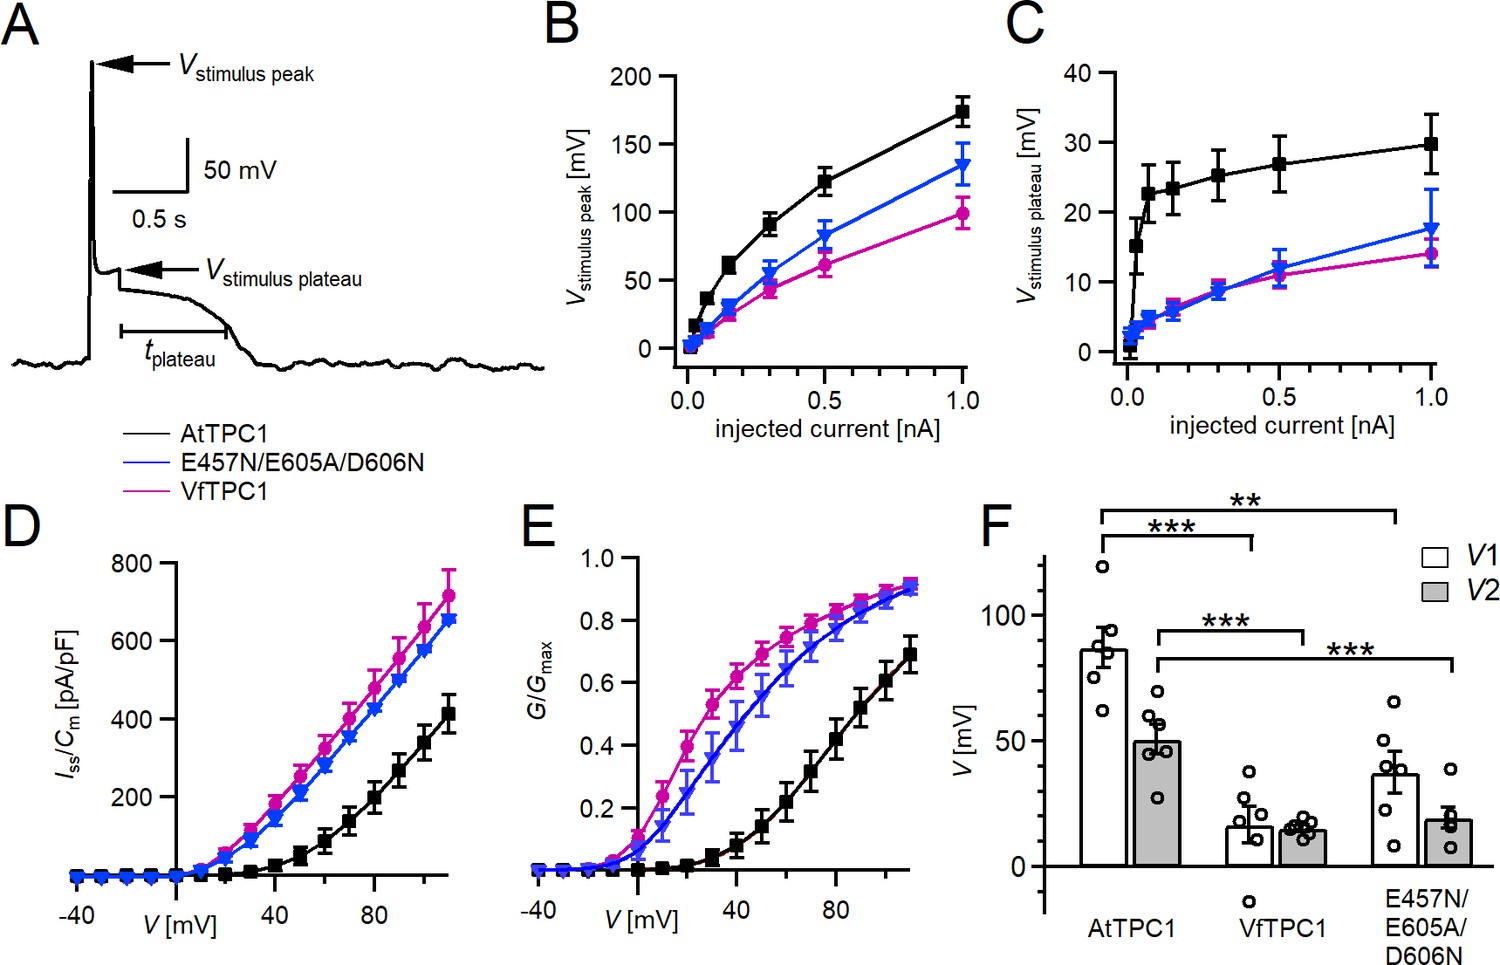
Excitability of vacuoles with corresponding TPC1 channel activity.
(A) Representative voltage recording from an AtTPC1-wild-type vacuole before, during, and after 100 pA current injection. The voltage peak and plateau levels during current stimulation (Vstimulus peak and Vstimulus plateau, respectively) and the duration of the post-stimulus depolarization phase are indicated. Amplitudes of peak (B) and plateau (C) voltages during current stimulation recorded from vacuoles equipped with the indicated TPC1 channel variants. (D) Normalized currents (Iss/Cm) mediated by the indicated TPC1 channel variant plotted against the respective membrane voltages. (E) Normalized conductance–voltage plots (G/Gmax(V)) determined for the different TPC1 channel variants as a measure for their relative open-channel probability. Best fits of the G/V plots to a double Boltzmann function are given by the solid lines. (F) Midpoint voltages V1 and V2 derived from the fits of the G(V) curves shown in (E). V1/2 values were tested for significant differences with one-way analysis of variance (ANOVA) followed by a Dunnett’s post hoc comparison test (**p < 0.01, ***p < 0.001). In (B–F), symbols represent means ± standard error (SE) (squares = AtTPC1 wild type; circles = VfTPC1 wild type; triangles = AtTPC1-E457/E605A/D606N). Number of experiments with individual vacuoles for each channel type was n = 6. In (F), individual data points were inserted as open black circles into the bar chart. All experiments were carried out under symmetric K+ conditions (150 mM) at 0.2 mM luminal free Ca2+ and 1 mM Ca2+ together with 2 mM Mg2+ at the cytosolic side of the membrane.
Figure 13
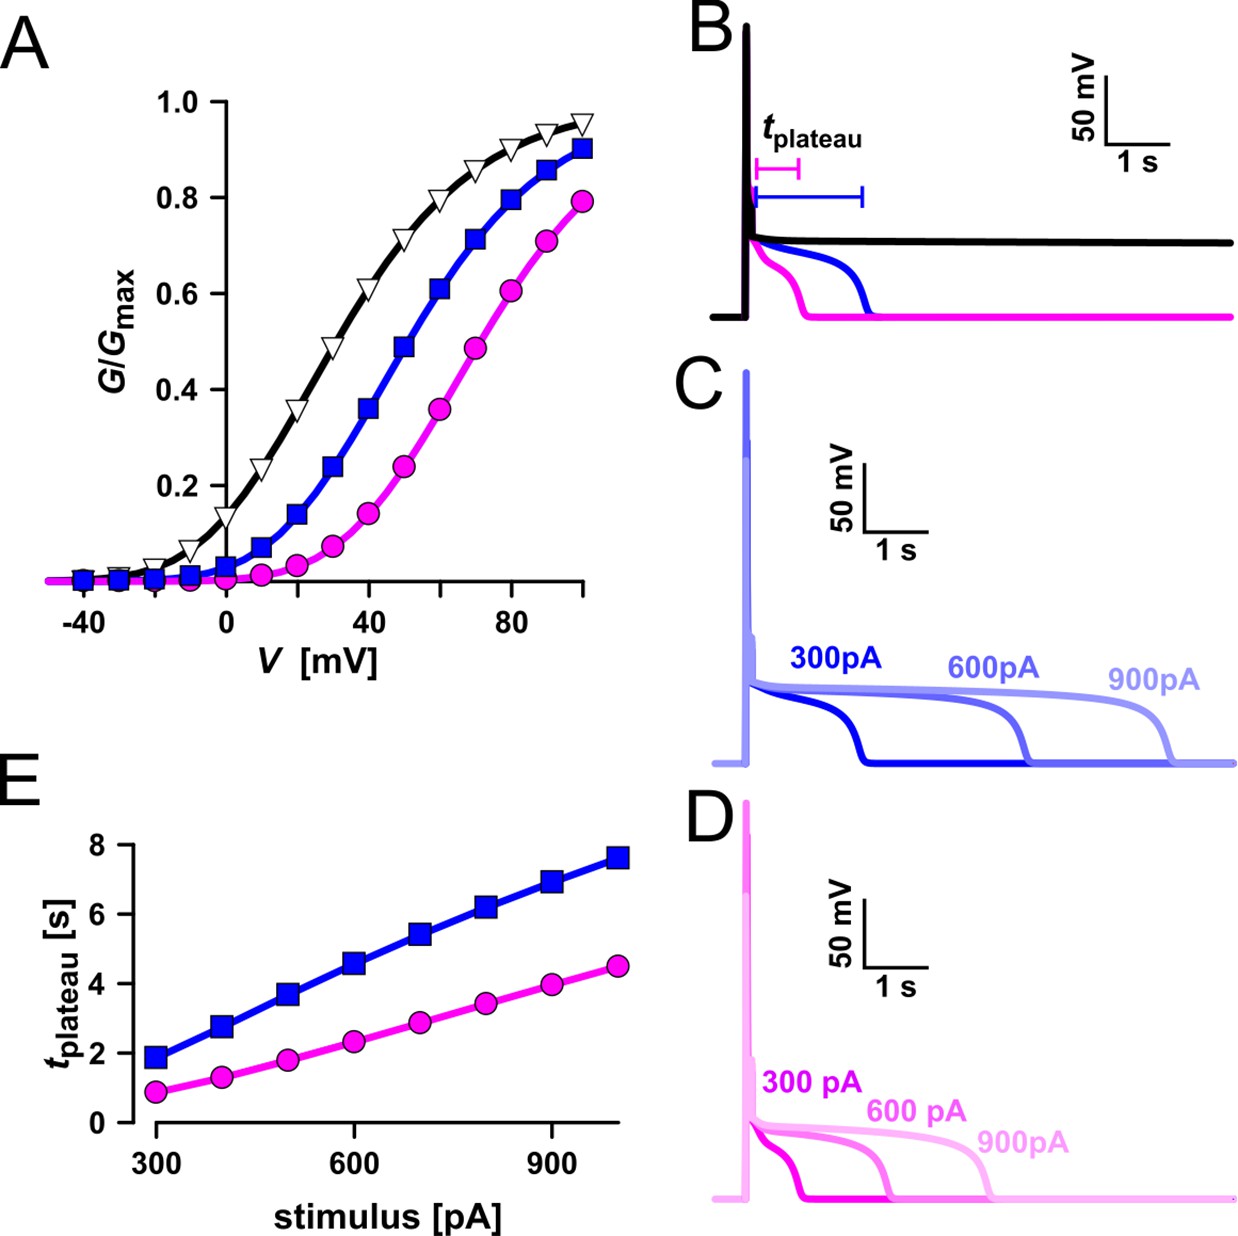
Simulation of vacuolar electrical excitability with three different TPC1 variants.
(A) Gating characteristics (G/Gmax) of three different TPC1-type channels. (B) Simulation of vacuolar electrical excitability with the different TPC1 variants. Excitation was induced by a 300-pA pulse of 100 ms duration. (C) Overlay of the electrical response of the vacuole having the blue-type TPC1 to 100 ms pulses of 300, 600, and 900 pA. (D) Overlay of the electrical response of the vacuole having the red-type TPC1 to 100 ms pulses of 300, 600, and 900 pA. (E) Dependency of the length of the post-stimulus plateau phase on the stimulus strength.
-
Figure 13—source data 1
Quantification of computationally simulated excitability shown in Figure 13.
- https://cdn.elifesciences.org/articles/86384/elife-86384-fig13-data1-v1.xlsx
Appendix 1—figure 1
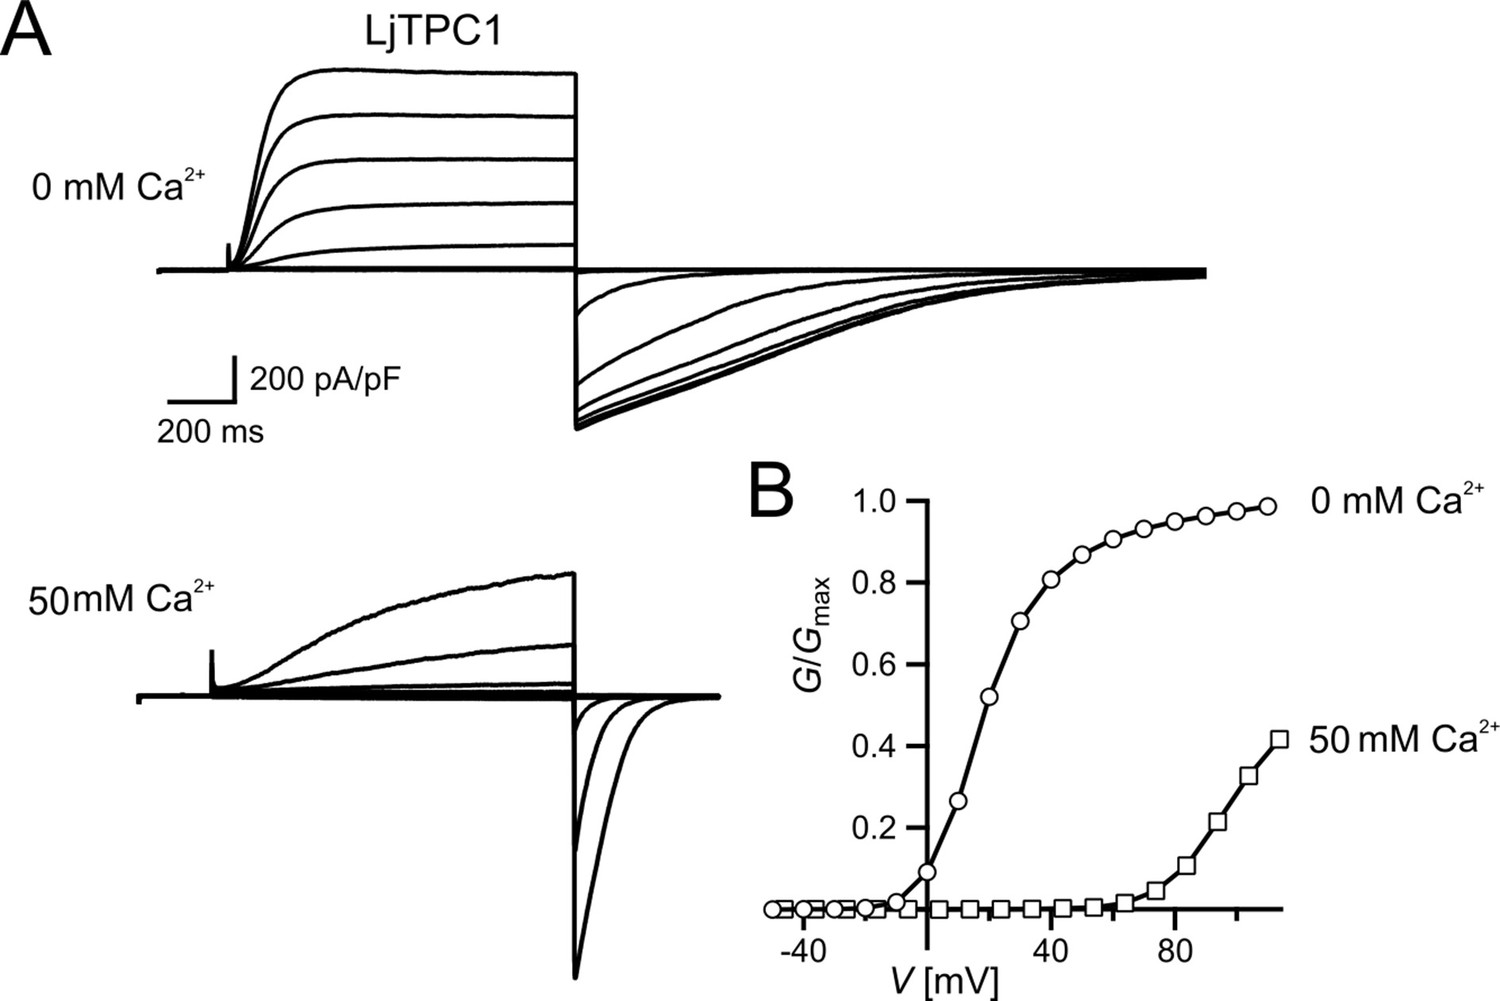
Similar voltage-dependent gating behavior of TPC1 from Lotus japonicus.
(A) Macroscopic TPC1 current recordings from individual mesophyll vacuoles at 0 and 50 mM luminal Ca2+ after transient transformation of Arabidopsis thaliana mesophyll protoplasts (attpc1-2) with LjTPC1 from L. japonicus TPC1 currents. Currents were elicited upon depolarizing voltages pulses in the range of −80 to +110 mV in 20 mV increments. Before and after these voltage pulses, the membrane was clamped to the holding voltage of −60 mV. The total time interval between voltage pulses at holding voltage was 4 s. (B) Normalized conductance–voltage plots (G/Gmax(V)) determined for the LjTPC1 currents shown in (A) in the absence and presence of luminal Ca2+ as indicated. Best fits of the G/V plots to a double Boltzmann function are given by the solid lines. Experiments were performed under symmetric K+ conditions (150 mM) with 1 mM cytosolic Ca2+ and luminal Ca2+ at indicated concentration. For more details on the voltage protocol and solutions, see Materials and methods. Source data are given in Appendix 1—figure 1—source data 1.
-
Appendix 1—figure 1—source data 1
Quantification of voltage-clamp data shown in Appendix 1—figure 1.
- https://cdn.elifesciences.org/articles/86384/elife-86384-app1-fig1-data1-v1.xlsx
Author response image 1
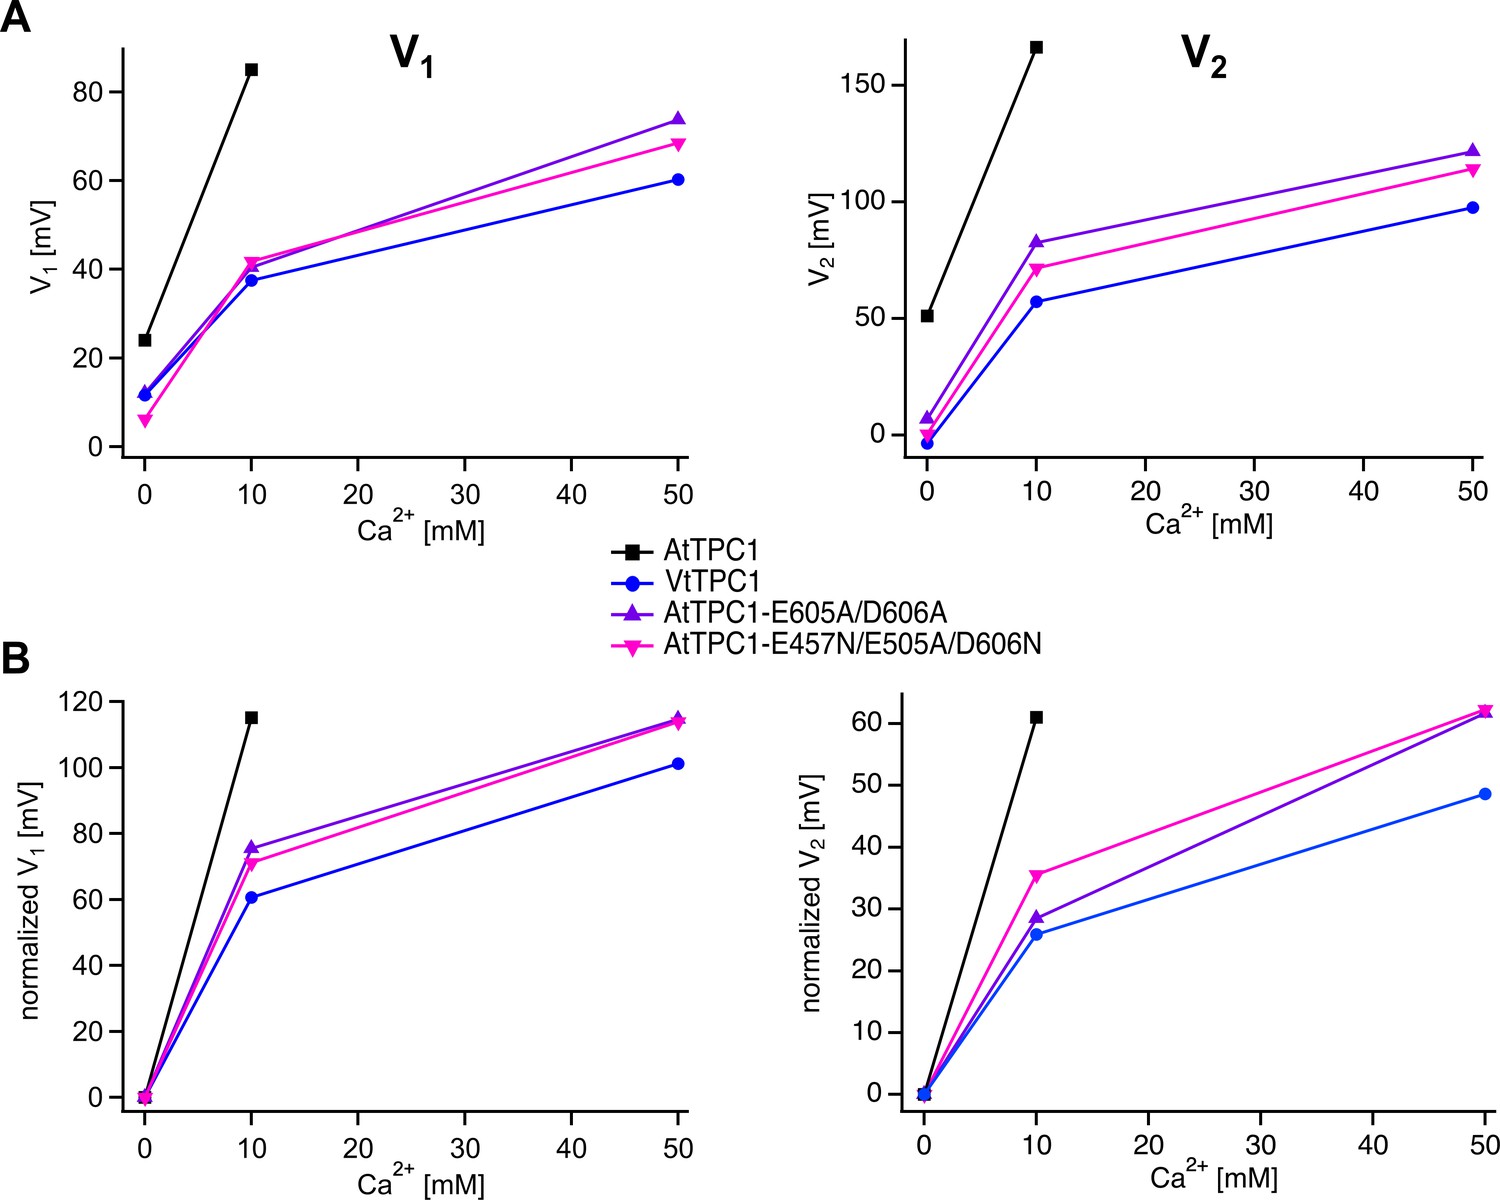
Luminal Ca2+ dose dependence of voltage activation of TPC1 channel variants.
Absolute (A) and normalized (B) voltage activation midpoints V1 and V2 derived from G/V curves (Figure 5) of the indicated TPC1 channel variants plotted against the corresponding luminal Ca2+ concentration.
Tables
Table 1
Relative cation permeability of TPC1 channel variants determined from the reversal potential under bi-ionic conditions in TPC1-expressing HEK cells.
| Channel variant | PK/PNaMean ± SD (n) | PCa/PNaMean ± SD (n) |
|---|---|---|
| AtTPC1 wild type | 0.75 ± 0.08 (5)*** | - |
| AtTPC1E605A/D606A | 0.85 ± 0.14 (6)** | 5.43 ± 0.69 (4) |
| AtTPC1D240A/D454A/E528A | 0.85 ± 0.09 (5)** | 5.50 ± 0.45 (4) |
| VfTPC1 wild type | 1.18 ± 0.11 (4) | 5.92 ± 0.52 (4) |
-
Significant differences of PK/PNa between AtTPC1 channel variants and VfTPC1 (**p < 0.01; ***p < 0.001) determined with one-way analysis of variance (ANOVA) together with a Dunnett’s post hoc comparison test. The relative permeability ratios (PK/ca/PNa) obtained for AtTPC1 wild type and the AtTPC1 mutant D240A/D454A/E528A were similar to those published in Guo et al., 2017. Note that a similar relative permeability ratio PK/PNa of 0.77 ± 0.05 (mean ± SD, n = 3) was also determined from TPC1 current relaxations (Figure 10—figure supplement 1) recorded from wild-type mesophyll vacuoles of Arabidopsis thaliana.
-
Table 1—source data 1
Quantification of relative cation permeability of TPC1 channel variants.
- https://cdn.elifesciences.org/articles/86384/elife-86384-table1-data1-v1.xlsx
Author response table 1
Single channel conductance of TPC1/SV currents in Vicia faba guard cells (Ward and Schroeder 1995, doi 10.1105/tpc.6.5.669).
| Pipette solution in mM(luminal side) | Bath medium in mM(cytosolic side) | Single channel conductance | ||||
|---|---|---|---|---|---|---|
| K+ | Ca2+ | pH | K+ | Ca2+ | pH | |
| 0 | 50 | 5.5 | 0 | 5 | 7.2 | 16 pS |
| 0 | 50 | 5.5 | 100 | 5 | 7.2 | 117 pS |
| 100 | 5 | 5.5 | 100 | 1 | 7.2 | 155 pS |
Author response table 2
Single channel conductance of VfTPC1 expressed in Arabidopsis thaliana vacuoles (Lu al., present manuscript, Figure 11).
| Pipette solution in mM(luminal side) | Bath medium in mM(cytosolic side) | Single channel conductance | ||||
|---|---|---|---|---|---|---|
| K+ | Ca2+ | pH | K+ | Ca2+ | pH | |
| 100 | 0 | 5.5 | 100 | 0.5 | 7.5 | 250 pS |
Additional files
-
Supplementary file 1
Homology model of Vicia faba TPC1 based on the experimental AtTPC1 D454N (fou2) Ca2+-bound structure (Dickinson et al., 2022; PDB: 7TBG).
- https://cdn.elifesciences.org/articles/86384/elife-86384-supp1-v1.pdb
-
Supplementary file 2
Primer sequences for subcloning and side-directed mutagenesis.
- https://cdn.elifesciences.org/articles/86384/elife-86384-supp2-v1.docx
-
Supplementary file 3
Details of the method used for computational simulation of electrical excitability shown in Figure 13.
- https://cdn.elifesciences.org/articles/86384/elife-86384-supp3-v1.docx
-
MDAR checklist
- https://cdn.elifesciences.org/articles/86384/elife-86384-mdarchecklist1-v1.pdf
-
Appendix 1—figure 1—source data 1
Quantification of voltage-clamp data shown in Appendix 1—figure 1.
- https://cdn.elifesciences.org/articles/86384/elife-86384-app1-fig1-data1-v1.xlsx
Download links
A two-part list of links to download the article, or parts of the article, in various formats.
Downloads (link to download the article as PDF)
Open citations (links to open the citations from this article in various online reference manager services)
Cite this article (links to download the citations from this article in formats compatible with various reference manager tools)
Vicia faba SV channel VfTPC1 is a hyperexcitable variant of plant vacuole Two Pore Channels
eLife 12:e86384.
https://doi.org/10.7554/eLife.86384


